


OEE, or Overall Equipment Effectiveness, is a metric or micro-indicator used to measure the efficiency of individual assets (equipment or machinery). It represents the percentage of actual production time that is effectively utilized. OEE originated in Japan around 1960 and was described as a key component of the Total Productive Maintenance (TPM) methodology and quality systems in the industry.
Seiichi Nakajima, Vice President of the Japan Institute of Plant Maintenance, is credited with being one of the pioneers in promoting TPM. TPM gained wide acceptance in the early 1970s.
Why use OEE?
“What gets measured gets improved.” Therefore, the industry has a constant need to measure the efficiency of production processes. By using OEE as an indicator to measure the actual efficiency of processes as a percentage, we enable the opportunity to identify areas for improvement by comparing current performance against the maximum achievable during the production process.
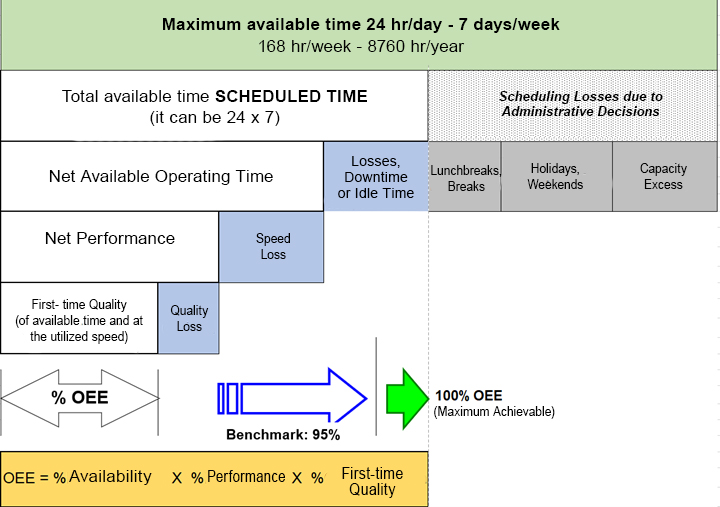
OEE has three key components that are measured as percentages:
- Availability: This concept takes into account all events that interrupt the planned production program, and it is estimated as follows:Availability = Run time / Available operating timeWhere run time is the actual production time after deducting the time for stops or inactivity during that period (model changes, material shortages, machine downtime, etc.).
- Performance: This concept considers all causes that result in a loss of speed compared to the maximum achievable speed (micro-stops and reduced process speed).Performance = (Total Count / Run Time) / Ideal Run RateIt represents the ratio of actual production to production capacity (standard production time) within a specified time.
- Quality: It represents the ratio of the number of good, defect-free pieces to the total number of pieces produced.Quality = Good Count / Total Count
OEE = % Availability x % Performance x % Quality
Therefore,
OEE = % Availability x % Performance x % Quality
Striving for Operational Excellence to achieve new levels of Quality and Efficiency has led to the expanded use of the OEE indicator at a macro level, allowing for the measurement of process productivity as a whole. When a process consists of multiple activities to reach the final product, the Overall Process Efficiency is considered as the product of the Overall Efficiency of each activity. This approach takes into account the demonstrated capacity at each step of the process, including the three key components: Availability, Performance, and Quality.
Efficiency Losses
- Unplanned machine breakdowns
- Material shortage
- Operator absence
- Tooling/model changeovers
- Production volume loss due to reduced speed compared to standard
- Machine time/speed adjustment due to learning curves
- Quality issues in the output product (rework and scrap)
No Comments
Sorry, the comment form is closed at this time.